 +91 253 6630710
 781.258.1274
 +44 (0) 7446 87 37 97
Wealth Management Reporting – How to create a personalized investing experience

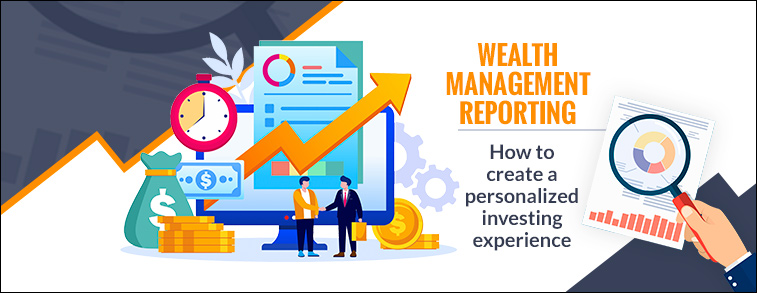
Wealth Management Reporting – How to create a personalized investing experience
The importance of data to the business of wealth management is starting to sink in as it is in other areas of business and financial services. The ability to better understand and service clients, provide a more personalized proposition, maintain compliance, identify risk, open up new investment opportunities - the list goes on.
Wealth management companies deal with a select group of “High Net worth Individuals” who are likely to have very little time. Therefore, it is imperative that the reports sent to them periodically are rich in visual representation and yet full of information. The traditional reporting in this industry is still long lists of each investment with “at purchase value” and “current value”. This even if accurate does not make for very easy reading especially when these HNI customers have massive portfolios. This needs to change. Not only should these reports be more interactive, but they should also be easier to absorb and give an accurate and honest picture at the first glance. Here are some ways in which this can be achieved for both “in print” and “online” reports:
1. Use Dashboards as the first page of the report which immediately gives a complete view of the portfolio: Important dashboards to look at could be
a. Current Status of asset allocation, number of clients, assets under management.
b. Statistics like historical returns, investment changes for different groups of investors.
c. Profitability (Revenues, Expenses, Commissions...)
d. Clients P&L (Gains, TWR - Performance %...)
2. Designing interactive and customizable dashboards which the customer can change and reorder as they best like to see it. For each client have an option to save the dashboard format and make it default for them.
3. Have a mobile version of these reports and dashboards. A mobile app will give the customer and option of looking at it whenever they wish. Typically, such folks spend a lot of time on the move and so a mobile app is very useful.
4. Use of gaming is another useful tool. This allows customer to run fantasy or make-believe investment portfolios and run them over periods of time. This gives them a sense of how their investments would have played out if structured differently. This tool can also be used by advisors to build investor confidence in their advisory.
5. Use data visualization tools like Power BI, Tableau, PowerON BI, Qlik as they provide rich insights into the wealth management data. While these solutions will not be attractive to all clients, their very existence is changing expectations about what clients want to see when it comes to their digital experience, the use of visualization techniques has shown to add value and build trust between advisors and high-net worth investors.
To conclude, a strong Data Visualization & Analysis capability can deliver a true competitive differentiator to a wealth management business across multiple aspects of their business. Aress’ certified data analytics and data visualization experts have a rich experience of building reports of such kinds along with exposure to building AI gaming tools aimed at creating a personalized investing experience. Our AI/ML experts can provide solutions to actively engage clients, increase efficiency, and help wealth advisors grow their business – in the office or on the go.

 Few
More from
Dev Kumbhare
Few
More from
Dev Kumbhare
Category: GenAI & Data Engineering
Recent Posts
-
Salesforce
Salesforce Implementation Checklist: 10 Non-Negotiables for Success in the Agentic Era
-
24x7 Technical Support
The MSP Margin Playbook: Total Cost of 24/7 Outsourced NOC Services vs. Building a Night Shift
-
Salesforce
Top Salesforce Consulting Partners in the USA (2026)
-
Digital
AI-Native Cloud Application Development: The Biggest Shift Reshaping Enterprise Software in 2026
-
Salesforce
Salesforce and Microsoft Azure Integration: Benefits, Architecture, Use Cases & Best Practices